Building a metrics framework that drives revenue
Product Strategy
Metrics Framework Design
Cross-Functional Leadership
Overview
I moved Intruder from relying on ad hoc revenue tracking to a scalable, behaviour-based measurement system.
I successfully lobbied for us to create a unified way to evaluate company strategy, make product decisions, and empower designers and product managers to lead with evidence.
The effort was so successful it was held up by Intruder’s BI tool as a case study in how to align a company around a shared set of metrics.
Involvement

Project manager

~2 month duration (Jul - Aug ‘24)

Figma, Posthog, Count and Dovetail.
Impact
Outcome > Output
Emphasis shifted to movement on key metrics rather than effort expended.
Externally Recognised
Recognised by Intruder’s BI tool (Count) as a exemplary case study in how to track product metrics.
100%
Adoption of Product Squads orientated around the vulnerability management lifecycle.
Challenge
Intruder measured success through ad hoc financial indicators with no consistent framework for evaluating product changes. Feature releases were assessed individually by Senior Leadership through lengthy debates, making it nearly impossible to tie revenue impact to specific user behaviours.
More than this the prevalent mindset that our customers should "set and forget" our tool obscured customer value and hindered strategic feature prioritisation.
Approach
Both myself and the Head of Support were keen to improve how we made decisions for our teams, and as a business, so together we proposed a framework I’d used elsewhere to the VP of Product to demonstrate.
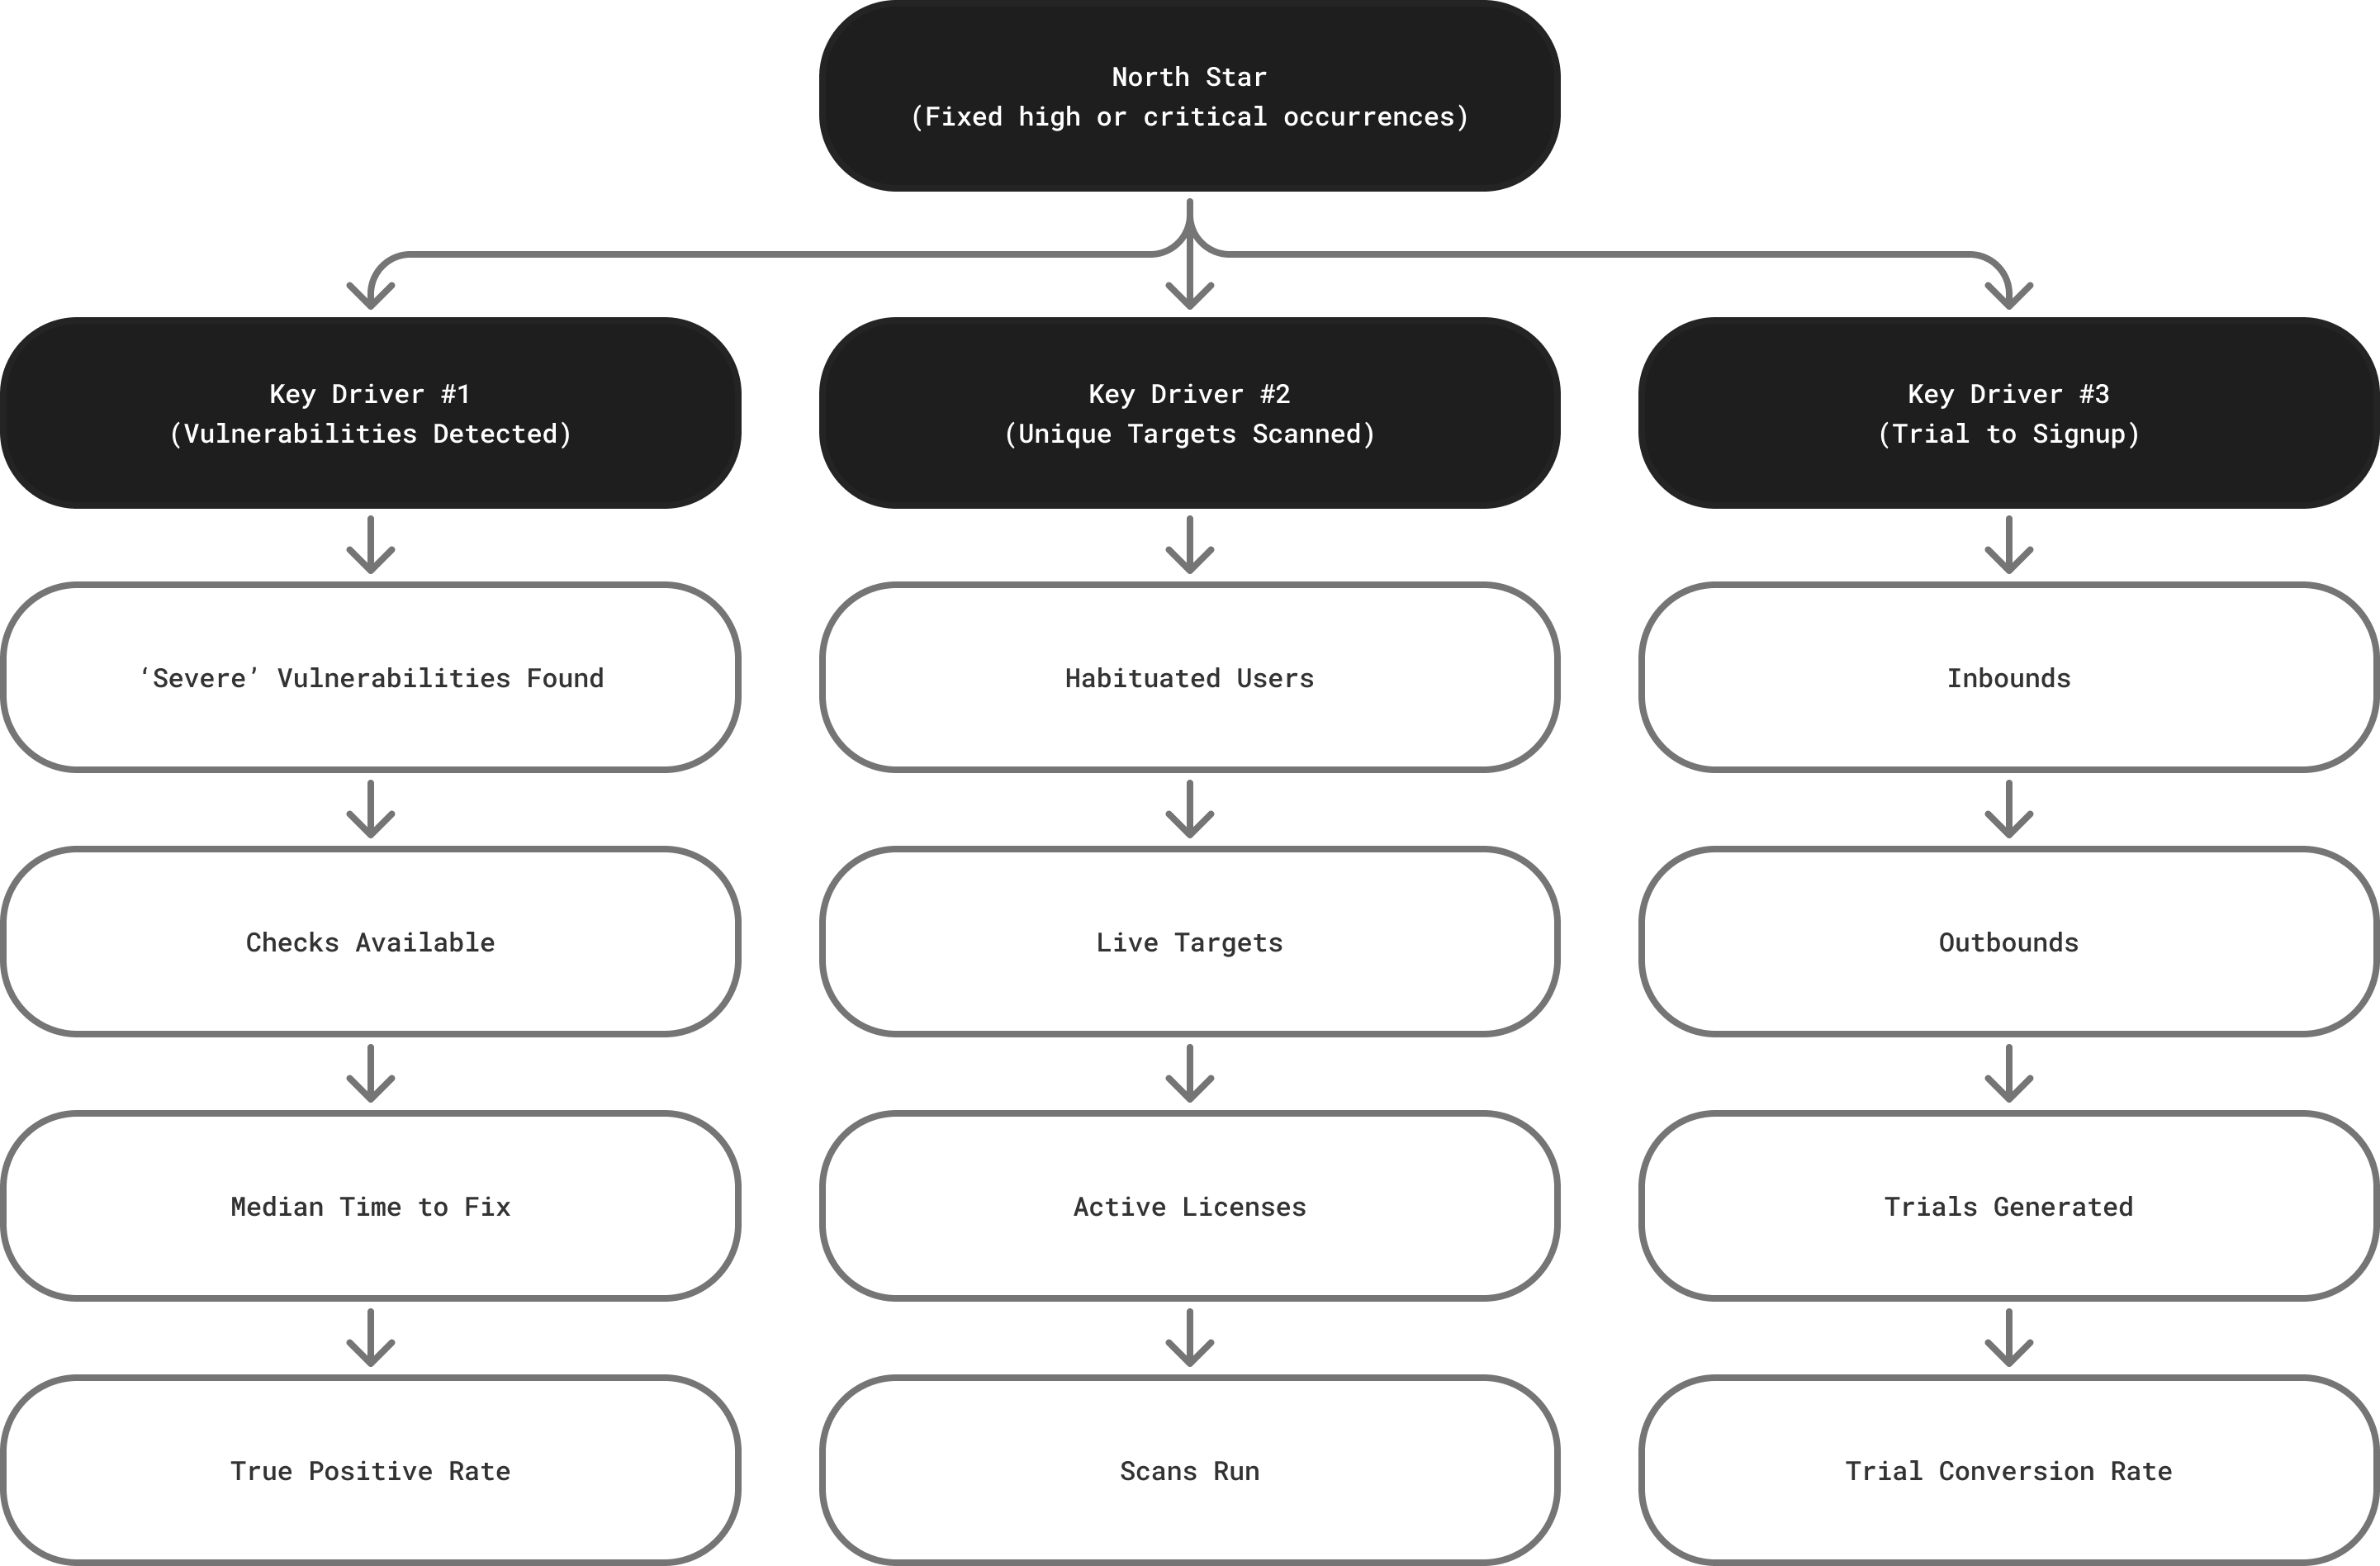
Defining the North Star
Through customer interviews and quantitative analysis, I mapped how customers experience Intruder's value. We identified the key moment customers felt impact: The first time customers found and fixed a serious security issue using our tool.
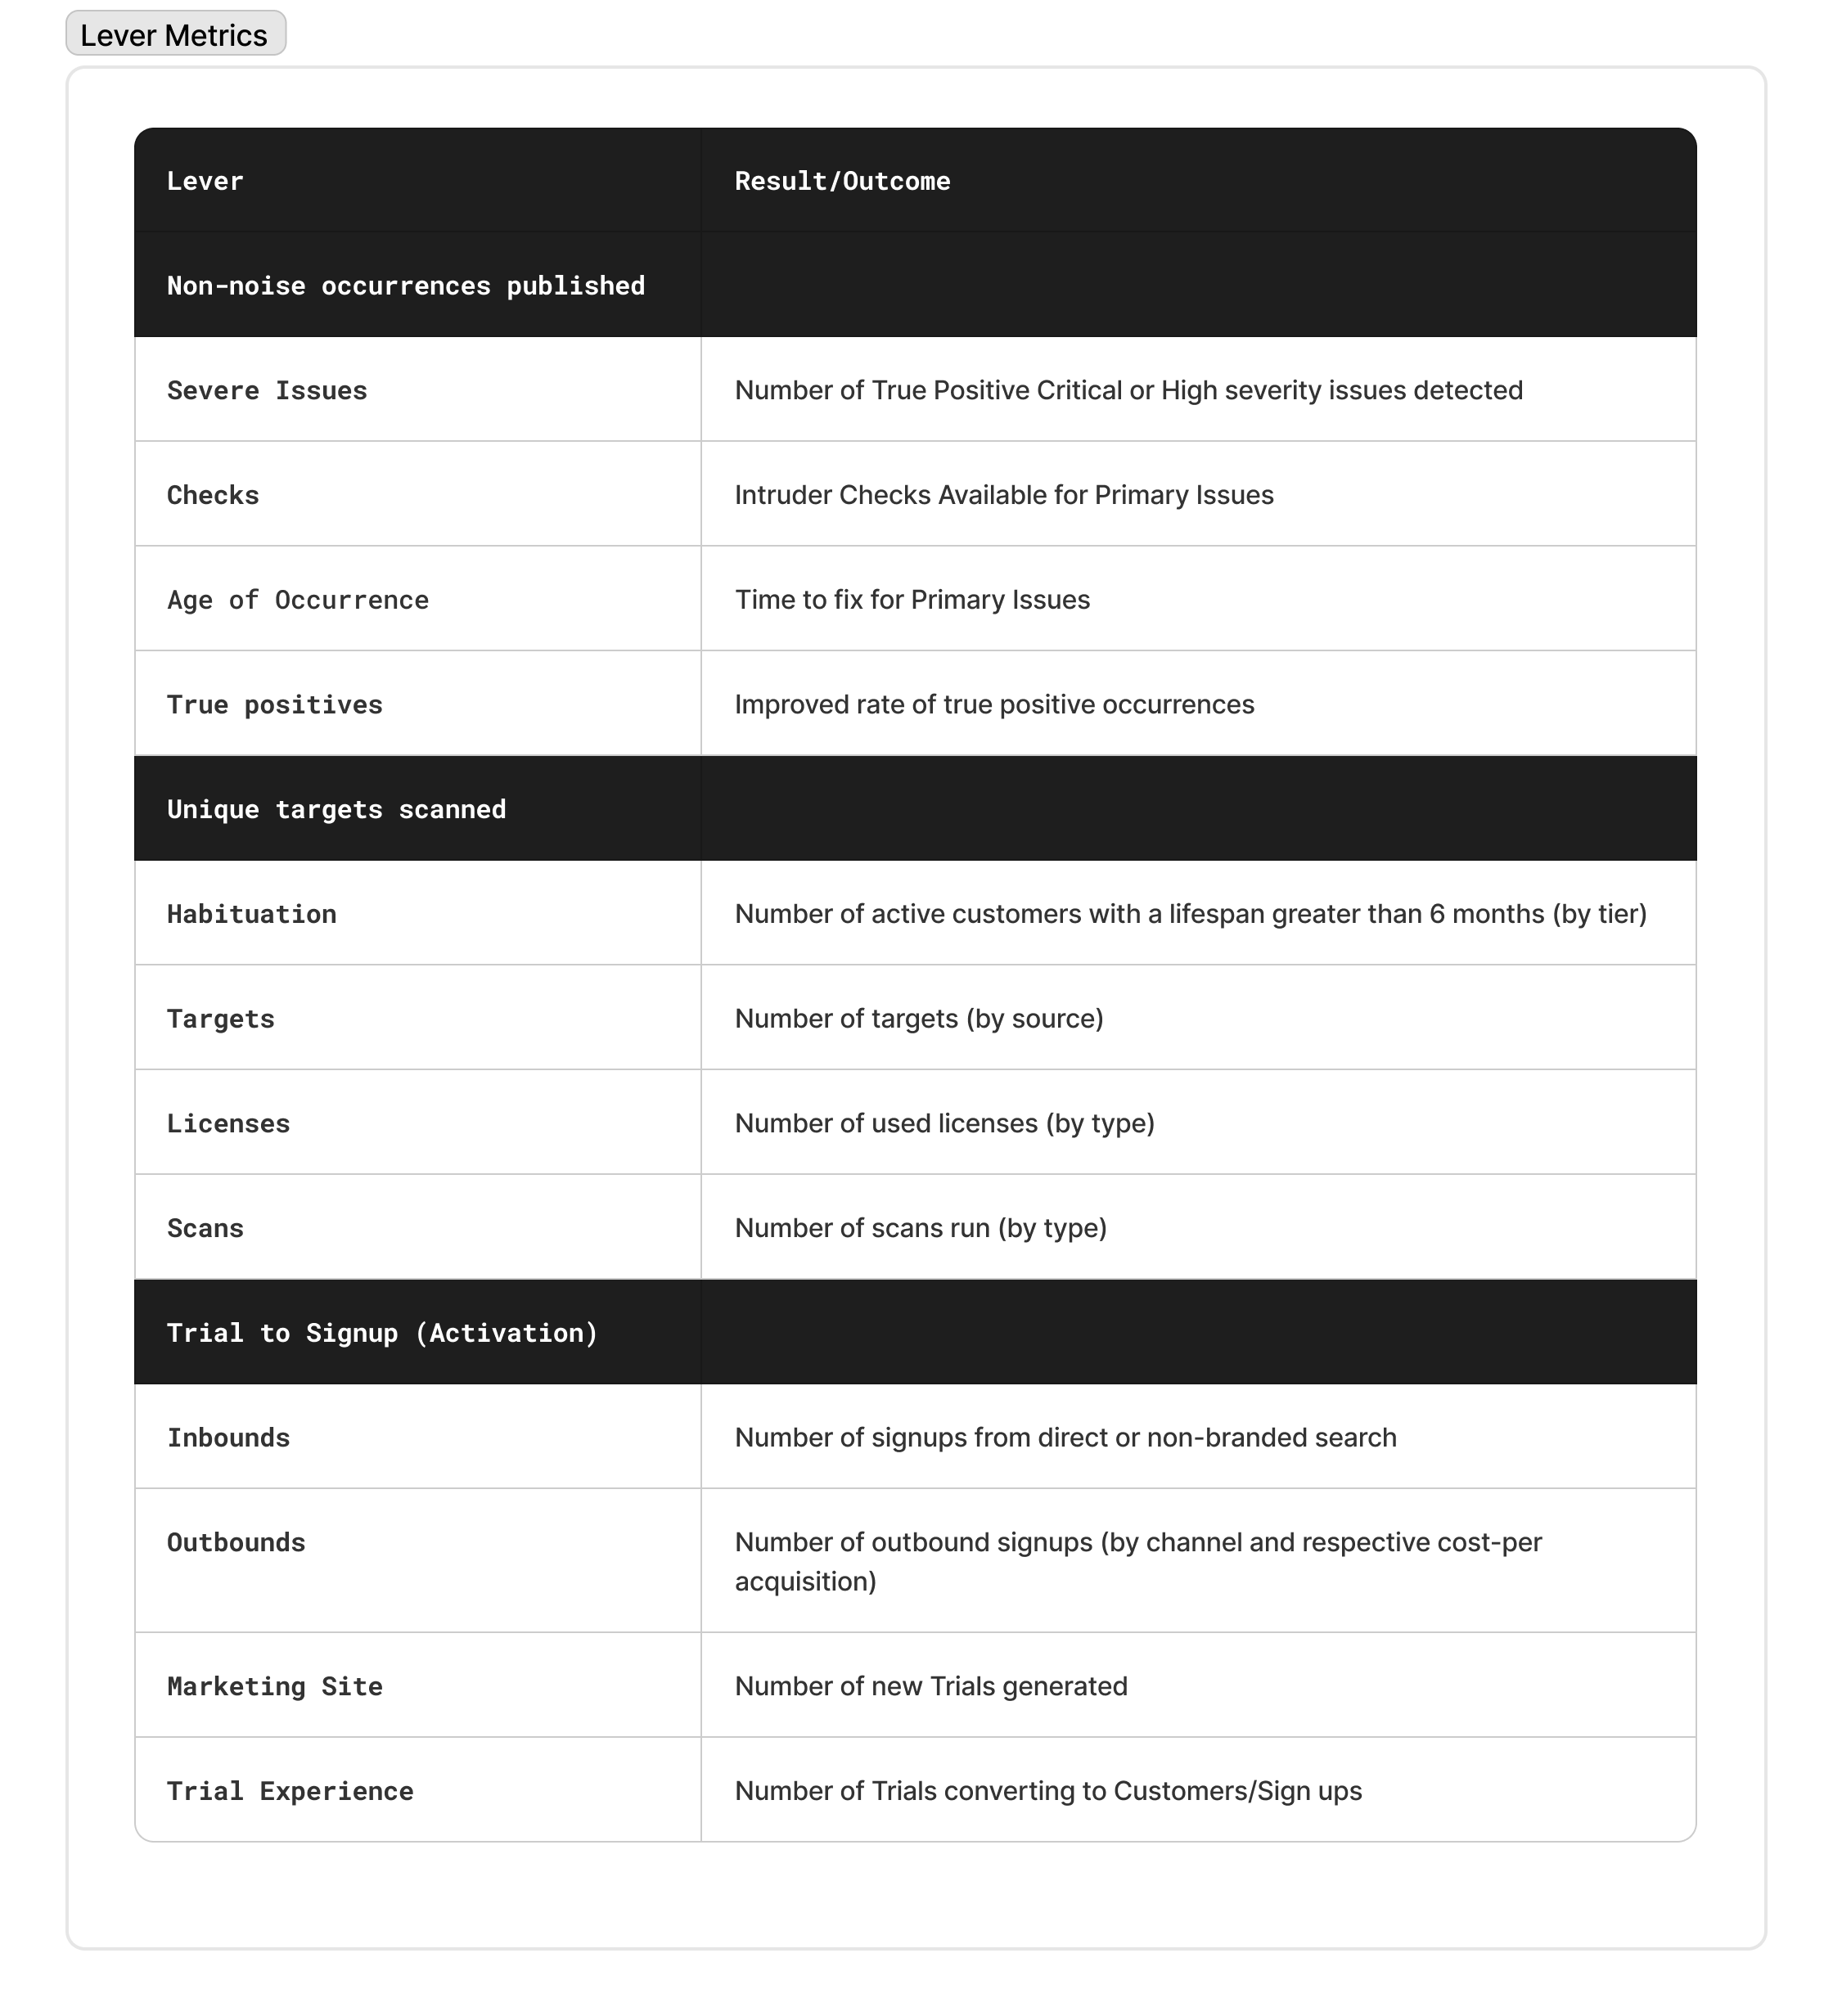
The initial list of our Key Drivers and their levers.
Framework featured by Count (Intruder’s BI tool) as an example in their webinar ‘Making OKRs Work’.
“The thing that sparked us moving away from those other tooling and going more towards this data-driven approach to OKRs … was Naomi, whose our Head of Support, and Keith, our Head of Design. They came to the senior leadership team and said this isn’t working … and because of them we had that discussion in the senior leadership team.”
Andy Hornegold, VP Product
Count webinar: Making OKRs Work: 13:12
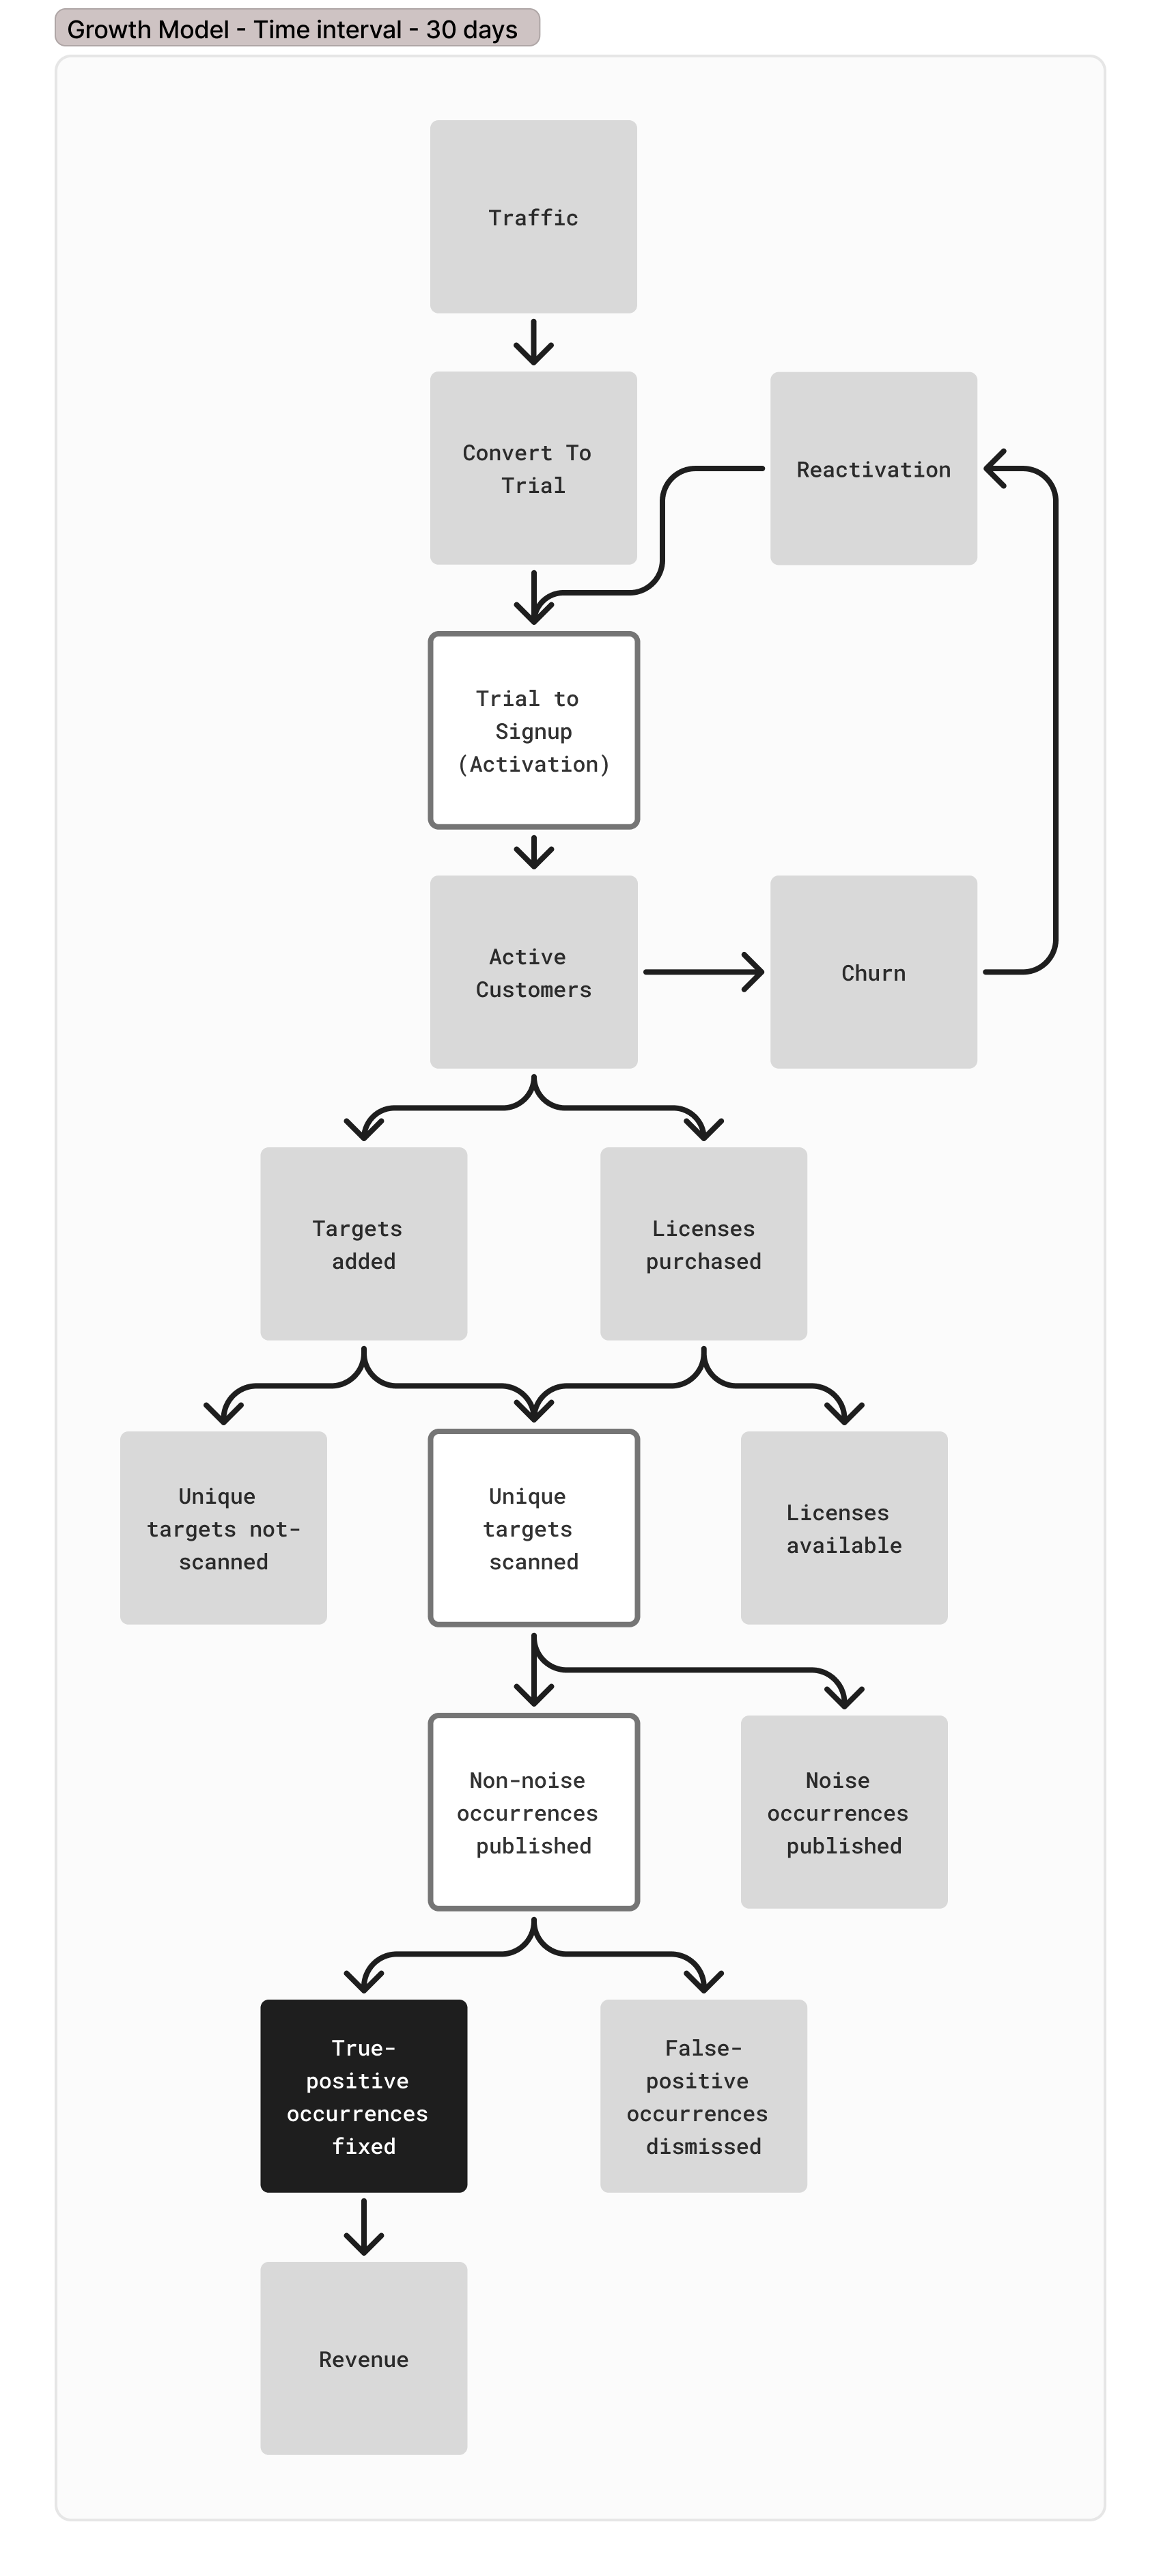
Building the Framework
- North Star Metric: Total high/critical occurrences fixed
- Key Drivers: Non-noise occurrences published, Unique targets scanned, Customers acquired
- Growth levers: Clear metrics which move the Key Drivers
I secured buy-in from the VP of Product , then presented the framework to Senior Leadership as a bridge between revenue goals and strategic product decisions.
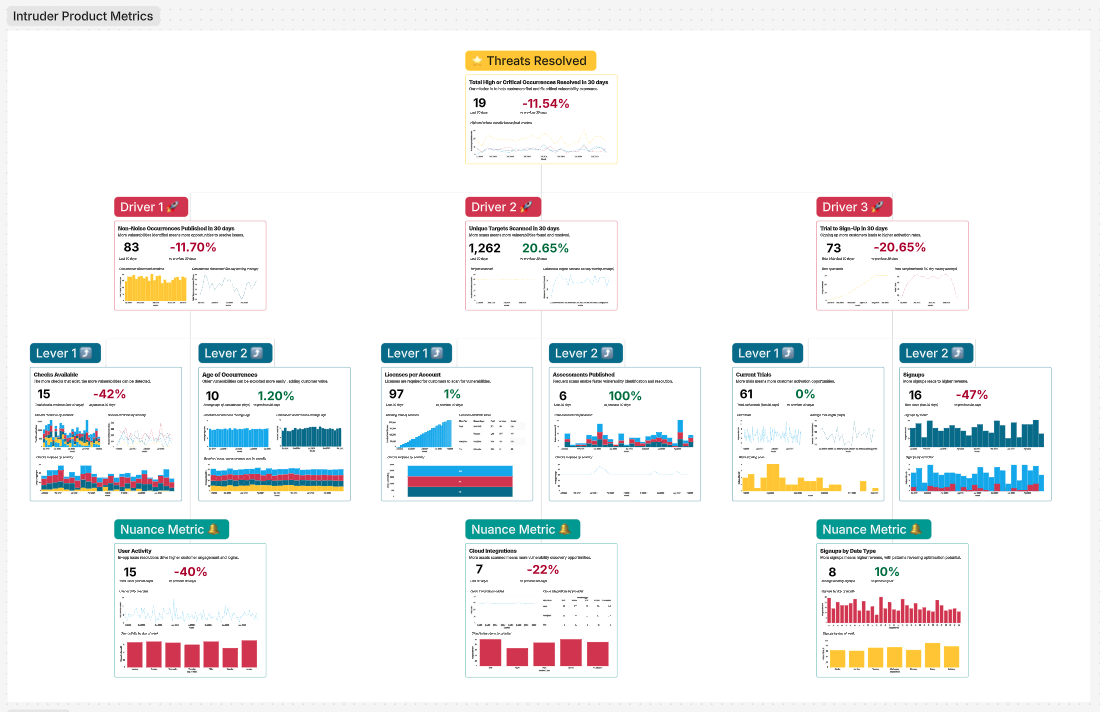
This framework was later recognised externally, with Count (our data platform) showcasing it as a case study in their webinar “Making OKRs Work.”
“I sat down with Keith, our Head of Product Design, and we tried to work out the key drivers … This really for me is about understanding at a top level whether all of the levers and components are moving in the right direction.”
Andy Hornegold, VP Product
Count webinar: Making OKRs Work: 28:31
Operational Layer: HEART Metrics
While the North Star framework provided company-wide strategy, operational teams needed practical validation for daily decisions. I implemented a tailored HEART framework (Happiness, Engagement, Adoption, Retention, Task Success):
- Mapped to platform lifecycle stages
- Enabled pre/post-launch behaviour assessment
- Integrated with feature flagging for measurable impact
- Created shared language across teams, reducing data team dependency
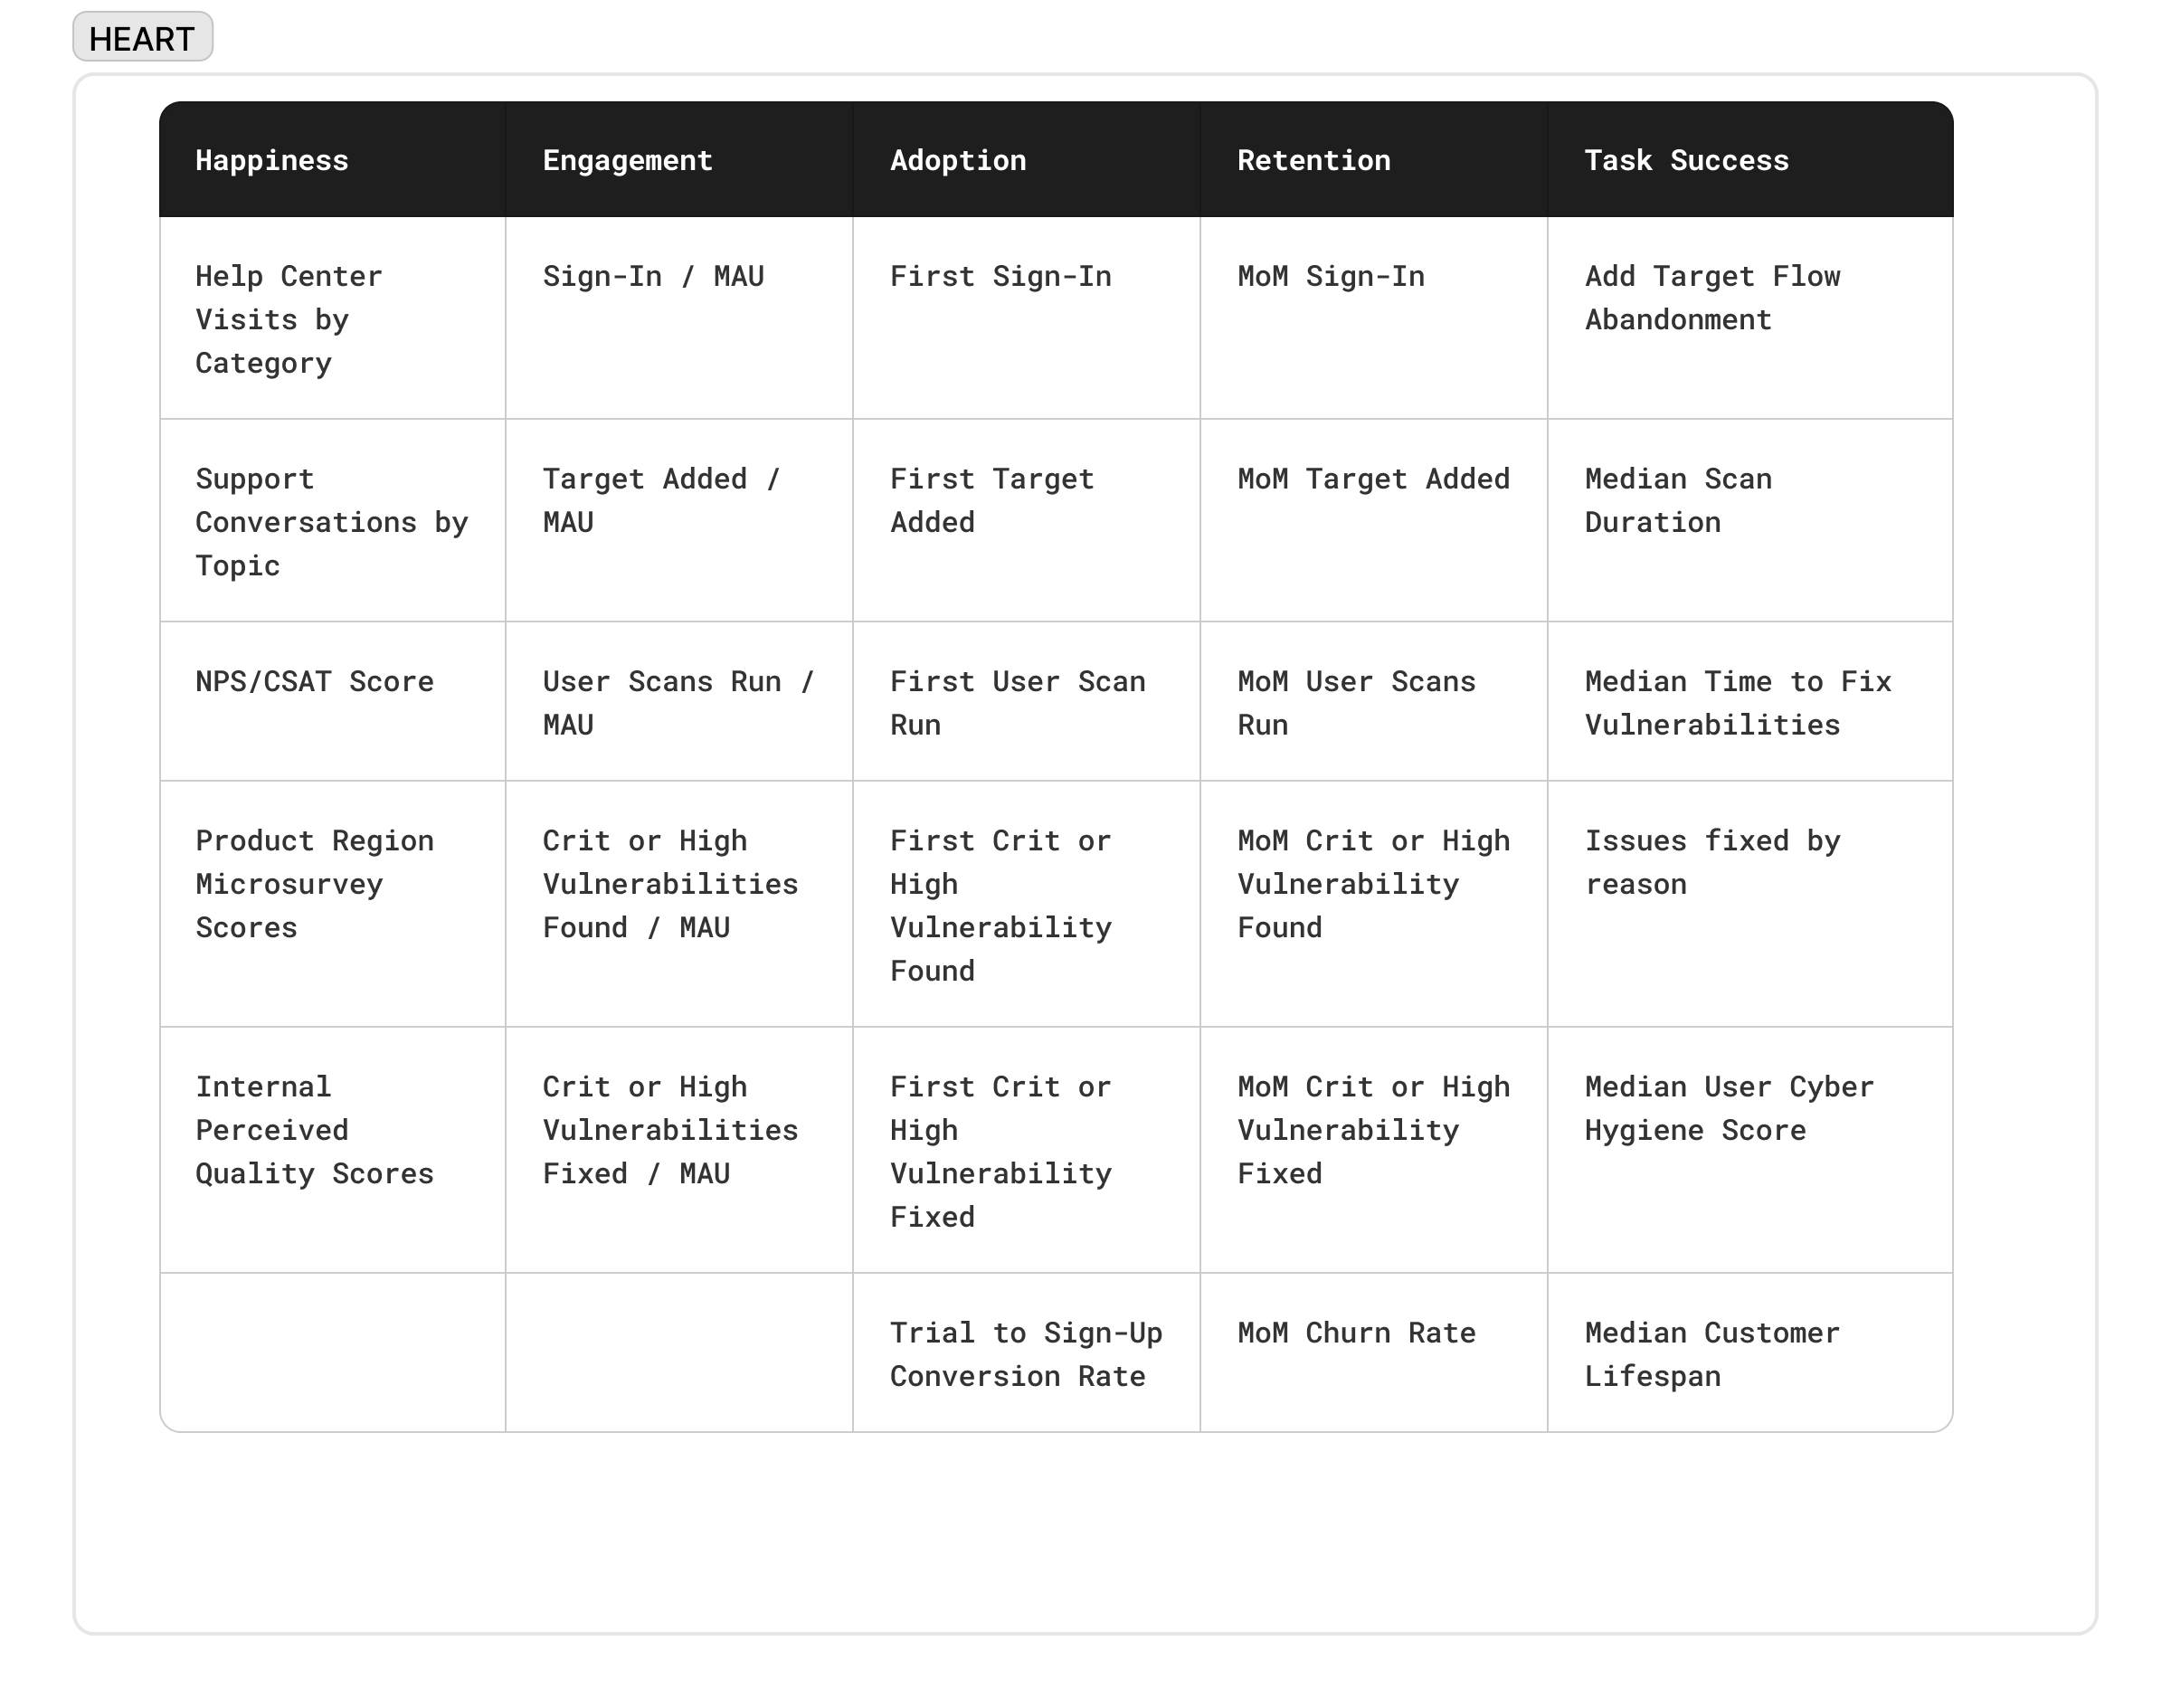
The initial list of Product Wide HEART Metrics
Our HEART Metrics allowed us to have clear tacticle
System Impact
Strategic Alignment
- Eliminated lengthy leadership debates with agreed success criteria
- Connected all product initiatives to business-critical outcomes
- Enabled Pod/Squad structure: Growth, Retention, and Experience teams
Operational Efficiency
- HEART became shared menu of success metrics for all initiatives
- Normalised pre-project success criteria and post-launch analysis
- Reduced designer reliance on data team for routine insights
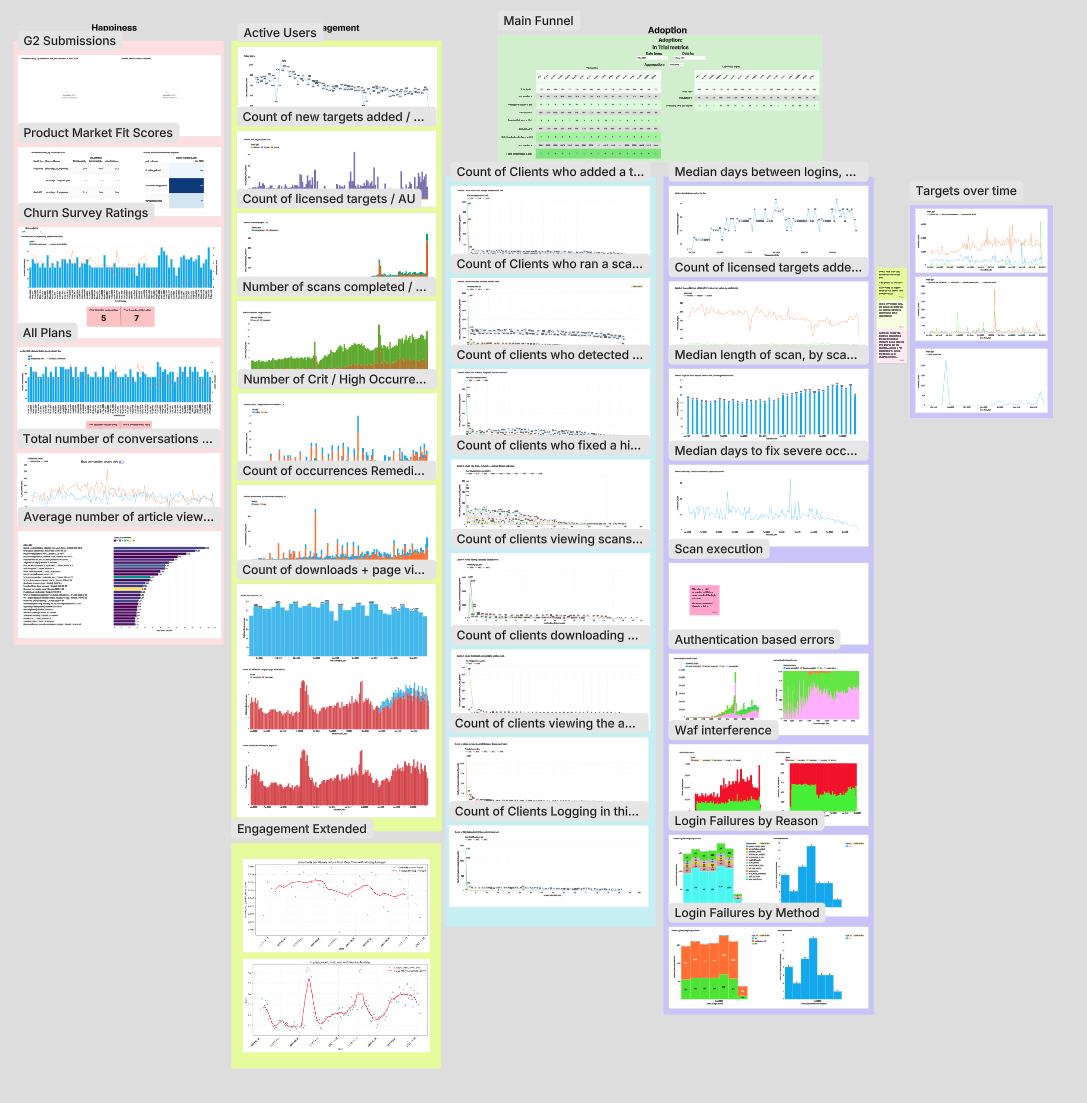
- Our use of HEART metrics and pre/post validation became not only the internal standard, but was also highlighted publicly by Count as an exemplar of effective measurement practice.
Real-World Applications
Dashboard Redesign
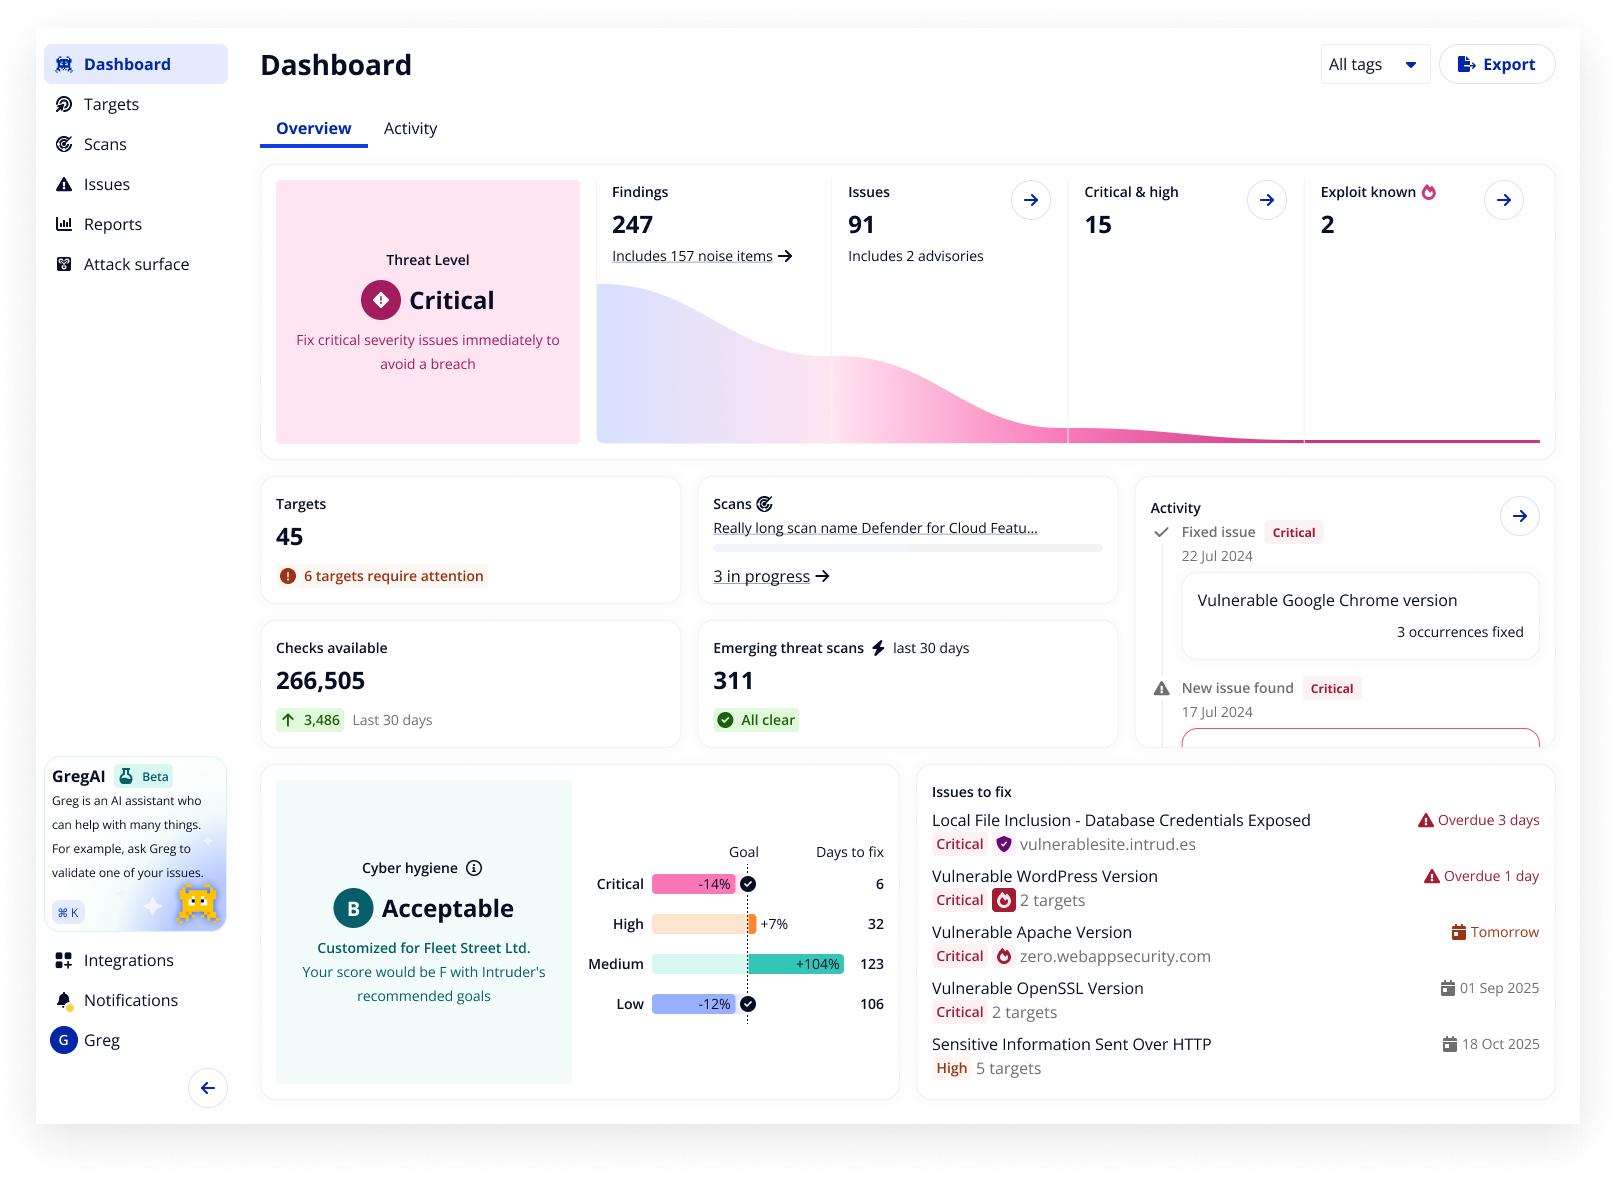
NB: This design was not done by me personally but facilitated by focusing on ‘Engagement’ (E) metrics in the HEART metrics so as to pull the ‘Targets’, ‘Licenses’, and ‘Scans’ Growth Levers to improve the ‘Unique Targets Scanned’ Driver.
Following the adoption of the HEART framework we reviewed the existing Dashboard. After a period of user research we proposed reframing the dashboard as a command centre for key actions.
The framework justified the investment by connecting user behaviour to North Star metrics. This led to a significant spike in key actions, increased time on page, higher activation and lifetime value.
Pain Point Prioritisation
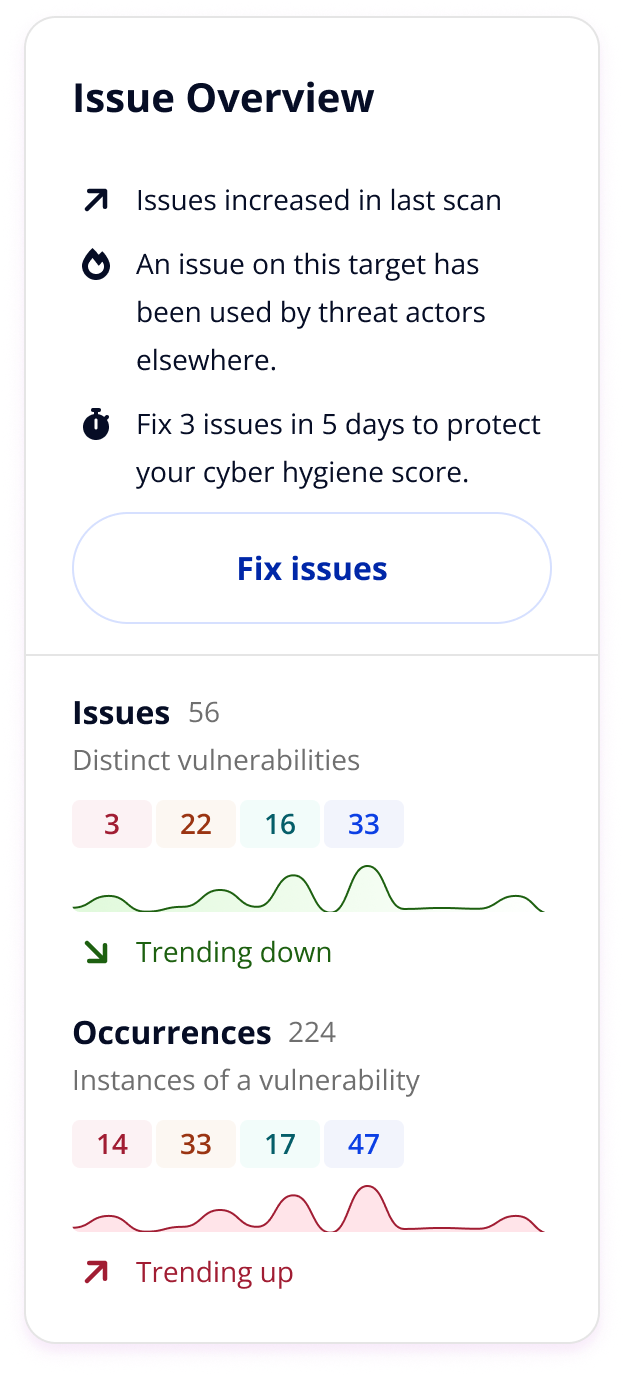
Popover designed to drive the Engagement by funnelling users towards fixing Issues. Something which ultimately aimed at pulling the Growth Lever ‘Median-Time-To-Remediate (MTTR)’.
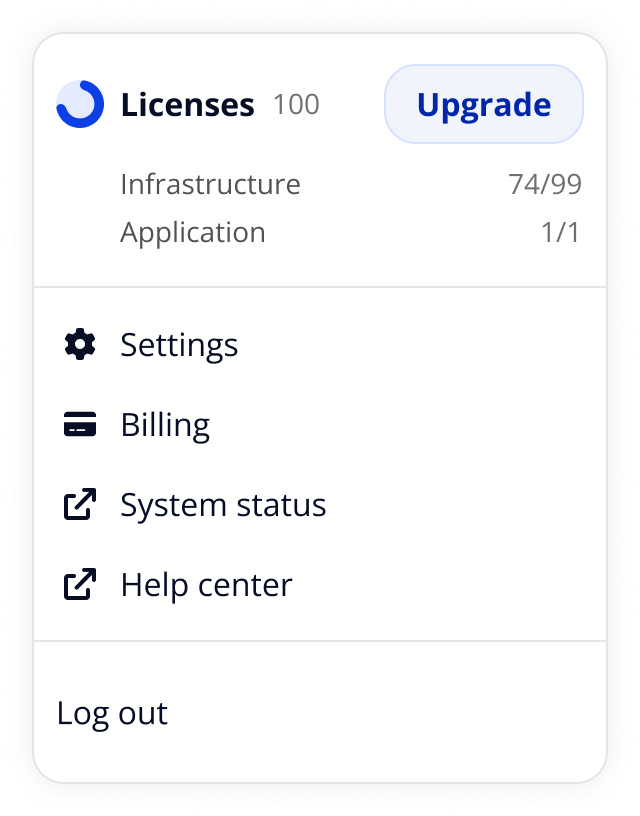
Popover iteration designed to drive the Retention by highlighting licensing status and making it easier to access the expansion funnel. Ultimately aimed at pulling the Growth Lever ‘Number of Licenses’.
These frameworks made it easy to demonstrate the benefit of new features it would have been harder to secure quantitative research for previously. Amongst many of the smaller, iterative, improvements we made the framework facilitated the following strategic shifts:
- Delaying the introduction of authentications for new users → increased activation
- Guided users toward successful authentication methods → higher lifetime value
- Introduced check relevance functionality → reduced noise, increased value
- New licensing flexibility → improved expansion revenue
Outcomes
Cultural Transformation
This change led to Intruder taking a increasingly customer orientated and behaviourally driven approach to strategy. We now had a clear connection between everyday work, company strategy, and business growth.
External Recognition
The framework gained recognition not only within Intruder but also externally, where it was showcased by Count in their webinar Making OKRs Work and featured in their public gallery.
- Count Webinar: Making OKRs Work — featured Intruder’s approach as a case study in effective metric-driven strategy.
- Count Gallery: Intruder OKR Canvas & Product Metrics Map — high-fidelity dashboards created by Count, based on the framework I developed.
Want to chat?
I’m always interested to hear about new opportunities, chances to collaborate,
or even just ideas people are exploring. Let’s connect.
Building a metrics framework that drives revenue
Product Strategy
Metrics Framework Design
Cross-Functional Leadership
Overview
I moved Intruder from relying on ad hoc revenue tracking to a scalable, behaviour-based measurement system.
I successfully lobbied for us to create a unified way to evaluate company strategy, make product decisions, and empower designers and product managers to lead with evidence.
The effort was so successful it was held up by Intruder’s BI tool as a case study in how to align a company around a shared set of metrics.
Involvement
Project manager
~2 month duration (Jul - Aug ‘24)
Figma, Posthog, Count and Dovetail.
Impact
Outcome > Output
Emphasis shifted to movement on key metrics rather than effort expended.
Externally Recognised
Recognised by Intruder’s BI tool (Count) as a exemplary case study in how to track product metrics.
100%
Adoption of Product Squads orientated around the vulnerability management lifecycle.
Challenge
Intruder measured success through ad hoc financial indicators with no consistent framework for evaluating product changes. Feature releases were assessed individually by Senior Leadership through lengthy debates, making it nearly impossible to tie revenue impact to specific user behaviours.
More than this the prevalent mindset that our customers should "set and forget" our tool obscured customer value and hindered strategic feature prioritisation.
Approach
Both myself and the Head of Support were keen to improve how we made decisions for our teams, and as a business, so together we proposed a framework I’d used elsewhere to the VP of Product to demonstrate.
Defining the North Star
Through customer interviews and quantitative analysis, I mapped how customers experience Intruder's value. We identified the key moment customers felt impact: The first time customers found and fixed a serious security issue using our tool.
The initial list of our Key Drivers and their levers.
Framework featured by Count (Intruder’s BI tool) as an example in their webinar ‘Making OKRs Work’.
“The thing that sparked us moving away from those other tooling and going more towards this data-driven approach to OKRs … was Naomi, whose our Head of Support, and Keith, our Head of Design. They came to the senior leadership team and said this isn’t working … and because of them we had that discussion in the senior leadership team.”
Andy Hornegold, VP Product
Count webinar: Making OKRs Work: 13:12
Building the Framework
- North Star Metric: Total high/critical occurrences fixed
- Key Drivers: Non-noise occurrences published, Unique targets scanned, Customers acquired
- Growth levers: Clear metrics which move the Key Drivers
I secured buy-in from the VP of Product , then presented the framework to Senior Leadership as a bridge between revenue goals and strategic product decisions.
This framework was later recognised externally, with Count (our data platform) showcasing it as a case study in their webinar “Making OKRs Work.”
“I sat down with Keith, our Head of Product Design, and we tried to work out the key drivers … This really for me is about understanding at a top level whether all of the levers and components are moving in the right direction.”
Andy Hornegold, VP Product
Count webinar: Making OKRs Work: 28:31
Operational Layer: HEART Metrics
While the North Star framework provided company-wide strategy, operational teams needed practical validation for daily decisions. I implemented a tailored HEART framework (Happiness, Engagement, Adoption, Retention, Task Success):
- Mapped to platform lifecycle stages
- Enabled pre/post-launch behaviour assessment
- Integrated with feature flagging for measurable impact
- Created shared language across teams, reducing data team dependency
The initial list of Product Wide HEART Metrics
Our HEART Metrics allowed us to have clear tacticle
System Impact
Strategic Alignment
- Eliminated lengthy leadership debates with agreed success criteria
- Connected all product initiatives to business-critical outcomes
- Enabled Pod/Squad structure: Growth, Retention, and Experience teams
Operational Efficiency
- HEART became shared menu of success metrics for all initiatives
- Normalised pre-project success criteria and post-launch analysis
- Reduced designer reliance on data team for routine insights
- Our use of HEART metrics and pre/post validation became not only the internal standard, but was also highlighted publicly by Count as an exemplar of effective measurement practice.
Real-World Applications
Dashboard Redesign
NB: This design was not done by me personally but facilitated by focusing on ‘Engagement’ (E) metrics in the HEART metrics so as to pull the ‘Targets’, ‘Licenses’, and ‘Scans’ Growth Levers to improve the ‘Unique Targets Scanned’ Driver.
Following the adoption of the HEART framework we reviewed the existing Dashboard. After a period of user research we proposed reframing the dashboard as a command centre for key actions.
The framework justified the investment by connecting user behaviour to North Star metrics. This led to a significant spike in key actions, increased time on page, higher activation and lifetime value.
Pain Point Prioritisation
Popover designed to drive the Engagement by funnelling users towards fixing Issues. Something which ultimately aimed at pulling the Growth Lever ‘Median-Time-To-Remediate (MTTR)’.
Popover iteration designed to drive the Retention by highlighting licensing status and making it easier to access the expansion funnel. Ultimately aimed at pulling the Growth Lever ‘Number of Licenses’.
These frameworks made it easy to demonstrate the benefit of new features it would have been harder to secure quantitative research for previously. Amongst many of the smaller, iterative, improvements we made the framework facilitated the following strategic shifts:
- Delaying the introduction of authentications for new users → increased activation
- Guided users toward successful authentication methods → higher lifetime value
- Introduced check relevance functionality → reduced noise, increased value
- New licensing flexibility → improved expansion revenue
Outcomes
Cultural Transformation
This change led to Intruder taking a increasingly customer orientated and behaviourally driven approach to strategy. We now had a clear connection between everyday work, company strategy, and business growth.
External Recognition
The framework gained recognition not only within Intruder but also externally, where it was showcased by Count in their webinar Making OKRs Work and featured in their public gallery.
- Count Webinar: Making OKRs Work — featured Intruder’s approach as a case study in effective metric-driven strategy.
- Count Gallery: Intruder OKR Canvas & Product Metrics Map — high-fidelity dashboards created by Count, based on the framework I developed.
Want to chat?
I’m always interested to hear about new opportunities, chances to collaborate,
or even just ideas people are exploring. Let’s connect.
Building a metrics framework that drives revenue
Product Strategy
Metrics Framework Design
Cross-Functional Leadership
Overview
I moved Intruder from relying on ad hoc revenue tracking to a scalable, behaviour-based measurement system.
I successfully lobbied for us to create a unified way to evaluate company strategy, make product decisions, and empower designers and product managers to lead with evidence.
The effort was so successful it was held up by Intruder’s BI tool as a case study in how to align a company around a shared set of metrics.
Involvement
Project manager
~2 month duration (Jul - Aug ‘24)
Figma, Posthog, Count and Dovetail.
Impact
Outcome > Output
Emphasis shifted to movement on key metrics rather than effort expended.
Externally Recognised
Recognised by Intruder’s BI tool (Count) as a exemplary case study in how to track product metrics.
100%
Adoption of Product Squads orientated around the vulnerability management lifecycle.
Challenge
Intruder measured success through ad hoc financial indicators with no consistent framework for evaluating product changes. Feature releases were assessed individually by Senior Leadership through lengthy debates, making it nearly impossible to tie revenue impact to specific user behaviours.
More than this the prevalent mindset that our customers should "set and forget" our tool obscured customer value and hindered strategic feature prioritisation.
Approach
Both myself and the Head of Support were keen to improve how we made decisions for our teams, and as a business, so together we proposed a framework I’d used elsewhere to the VP of Product to demonstrate.
Defining the North Star
Through customer interviews and quantitative analysis, I mapped how customers experience Intruder's value. We identified the key moment customers felt impact: The first time customers found and fixed a serious security issue using our tool.
The initial list of our Key Drivers and their levers.
Framework featured by Count (Intruder’s BI tool) as an example in their webinar ‘Making OKRs Work’.
“The thing that sparked us moving away from those other tooling and going more towards this data-driven approach to OKRs … was Naomi, whose our Head of Support, and Keith, our Head of Design. They came to the senior leadership team and said this isn’t working … and because of them we had that discussion in the senior leadership team.”
Andy Hornegold, VP Product
Count webinar: Making OKRs Work: 13:12
Building the Framework
- North Star Metric: Total high/critical occurrences fixed
- Key Drivers: Non-noise occurrences published, Unique targets scanned, Customers acquired
- Growth levers: Clear metrics which move the Key Drivers
I secured buy-in from the VP of Product , then presented the framework to Senior Leadership as a bridge between revenue goals and strategic product decisions.
This framework was later recognised externally, with Count (our data platform) showcasing it as a case study in their webinar “Making OKRs Work.”
“I sat down with Keith, our Head of Product Design, and we tried to work out the key drivers … This really for me is about understanding at a top level whether all of the levers and components are moving in the right direction.”
Andy Hornegold, VP Product
Count webinar: Making OKRs Work: 28:31
Operational Layer: HEART Metrics
While the North Star framework provided company-wide strategy, operational teams needed practical validation for daily decisions. I implemented a tailored HEART framework (Happiness, Engagement, Adoption, Retention, Task Success):
- Mapped to platform lifecycle stages
- Enabled pre/post-launch behaviour assessment
- Integrated with feature flagging for measurable impact
- Created shared language across teams, reducing data team dependency
The initial list of Product Wide HEART Metrics
Our HEART Metrics allowed us to have clear tactical overview of Portal activity.
System Impact
Strategic Alignment
- Eliminated lengthy leadership debates with agreed success criteria
- Connected all product initiatives to business-critical outcomes
- Enabled Pod/Squad structure: Growth, Retention, and Experience teams
Operational Efficiency
- HEART became shared menu of success metrics for all initiatives
- Normalised pre-project success criteria and post-launch analysis
- Reduced designer reliance on data team for routine insights
- Our use of HEART metrics and pre/post validation became not only the internal standard, but was also highlighted publicly by Count as an exemplar of effective measurement practice.
Real-World Applications
Dashboard Redesign
NB: This design was not done by me personally but facilitated by focusing on ‘Engagement’ (E) metrics in the HEART metrics so as to pull the ‘Targets’, ‘Licenses’, and ‘Scans’ Growth Levers to improve the ‘Unique Targets Scanned’ Driver.
Following the adoption of the HEART framework we reviewed the existing Dashboard. After a period of user research we proposed reframing the dashboard as a command centre for key actions.
The framework justified the investment by connecting user behaviour to North Star metrics. This led to a significant spike in key actions, increased time on page, higher activation and lifetime value.
Pain Point Prioritisation
Popover designed to drive the Engagement by funnelling users towards fixing Issues. Something which ultimately aimed at pulling the Growth Lever ‘Median-Time-To-Remediate (MTTR)’.
Popover iteration designed to drive the Retention by highlighting licensing status and making it easier to access the expansion funnel. Ultimately aimed at pulling the Growth Lever ‘Number of Licenses’.
These frameworks made it easy to demonstrate the benefit of new features it would have been harder to secure quantitative research for previously. Amongst many of the smaller, iterative, improvements we made the framework facilitated the following strategic shifts:
- Delaying the introduction of authentications for new users → increased activation
- Guided users toward successful authentication methods → higher lifetime value
- Introduced check relevance functionality → reduced noise, increased value
- New licensing flexibility → improved expansion revenue
Outcomes
Cultural Transformation
This change led to Intruder taking a increasingly customer orientated and behaviourally driven approach to strategy. We now had a clear connection between everyday work, company strategy, and business growth.
External Recognition
The framework gained recognition not only within Intruder but also externally, where it was showcased by Count in their webinar Making OKRs Work and featured in their public gallery.
- Count Webinar: Making OKRs Work — featured Intruder’s approach as a case study in effective metric-driven strategy.
- Count Gallery: Intruder OKR Canvas & Product Metrics Map — high-fidelity dashboards created by Count, based on the framework I developed.
Want to chat?
I’m always interested to hear about new opportunities, chances to collaborate,
or even just ideas people are exploring. Let’s connect.